7 min to read
Application Optimization - Design in Retrospect

Application Performance and endurance tests are a terrible duo. They let a badly designed application fester unnoticed for a considerable amount of time. The development team languishes in the bliss provided by the lack of attention and gains confidence in its ability to slime the ailing application into production. And lo! in one sudden swipe of the blade, these two hack the application into a million pieces!
Good upfront design is the best tool that will stand you in good stead when confronted by this onslaught. But we all know that in the pursuit of functional requirements, we allow everything else to take a backseat. It is possible to write a badly designed functional application. But it is much harder to swing it through the L&P (Load & Performance) gate.Hence, when barricaded there, the only resort we have is to do a retrospective analysis of the application. This analysis can take both static and dynamic forms. This article talks about this analysis.
Static Code Analysis
Static analysis is usually performed on the code base. The code base is subjected to a grueling interrogation by tools which can be readily integrated into the build. These tools include checkstyle, PMD and findbugs. All these tools have their repertoire of rules to check the code against and have the ability to generate bugs classified by priority. By appropriately tweaking these rules, it is possible to minimize the overwhelming affect created by a surfeit of bugs and at the same time probe deep into some design issues. This is a very important activity and needs to be performed in conjunction with dynamic analysis (which we will cover in the ensuing section) .
Many anti-patterns can be probed using static analysis tools if they can be caught using automation.
Many thread related bugs - such as the inappropriate usage of static variables, using a class level variable in a singleton etc.- can be unearthed using a static inspection of the source code. Ex: We can write a script that looks at spring configurations and identifies singletons. We can use this information in conjunction with a tool such as PMD (which facilitates introspection of code ) and identify which of these singletons have class level variables. Then we can find out which of the class level variables are injected using spring itself. The rest of them are probably populated in the process of serving requests and hence can be potential candidates for leakage of information across threads.
Consider the following class:
public class Foo {

 private  Renderer renderer;

 private String propertyName;

 private String x;

 ---

}
Spring configuration looks as follows:
<bean id="foo" class="Foo" >
  <property name="renderer" ref="renderer"/>
  <property name="propertyName" value="xyz"/>

</bean>
An inspection of the code can show that among the three class level variables present viz. renderer, propertyName and x, the only one that is not injected is “x” and hence it can be a candidate for potential leakage of information.
Dynamic Analysis of the Application
However, static analysis tools cannot help to judge the runtime behavior of the application. We need something that works hand in glove with the JVM to diagnose what the application does as it executes in the runtime environment. Profilers help with this. Profilers provide a bunch of information about various runtime aspects such as memory dumps, thread dumps (which can also be obtained by the way by doing a kill -3 on the Java process) and call trees. There are other features in profilers but I am going to chiefly concentrate on these three capabilities and my experience in using them to diagnose ailments of the application.
Call Tree
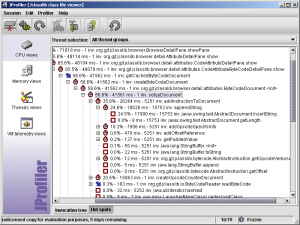
A profiler call tree gives the time taken at each layer as the request gets processed by the application. This is very useful to obtain the cause for the slow response of the application. Some of the glaring examples of the discoveries that we made due to the call tree trace include the following:
- We discovered several database queries that were running slow and needed tuning.
- We discovered that SQL was being executed at places that we did not suspect. This phenomenon has become increasingly prevalent with the wide spread adoption of ORM frameworks. The “Lazy loading” features of ORM can be a big performance bane if used inappropriately. We will discuss this more when we talk about data retrievals.
- It might come as a big surprise to people when I say that one of the most expensive operations was StringBuffer.toString(). This can be avoided by avoiding string concatenations- instead spit strings out into output streams as needed rather than trying to concatenate them. Alternately, use compiled string templating languages such as freemarker, velocity and StringTemplate. If you have to use StringBuffer, initialize one with a fixed length.
Ex: StringBuffer x = new StringBuffer(2000); is better than StringBuffer x = new StringBuffer(); even if you don’t use all the 2000 bytes.
- When using AXIS as a web service client, we found that it was taking longer to load the axis stub than to actually make the call! This lead to an optimization. We merely loaded the stubs during startup and cached them.
- One of the projects that I had been working on used a very bad random UUID generator which was exposed by the profiler.
Thread Dumps
As we stress test the application, there are certain points in time at which it would slow down and sometimes grind to a halt. At that twilight hour when the application is putting on the brakes, it is an appropriate time to take a thread dump. That can be easily achieved using several ways - kill -3 being the most popular one. An inspection of thread dumps provides an invaluable tool to analyze the application. An application slows down due to a variety of reasons:
- The application has attained the limit of scalability in the environment. This happens when the CPU or memory are maxed out.
- There can be locks and waits that can impede scalability.
The latter ailment is the malignant one and requires a careful probe of the thread dumps. A “grep” for the “waiting” keyword may be very helpful to find out what the threads are waiting on at this point in time. We will cover variations of “grep” in a separate article especially in relation to thread dump analysis. But for now, it is a good idea to track individual resources that are being waited on and to find out how many threads are waiting on particular resources. Some of the linux commands that can help in this would include:
- cut - to parse out fields from the output (see the -d option which should be used in conjunction with the -f option)
- awk - for the same reason but with more sophistication.
- sort - for sorting the output
- uniq - for finding duplicates (uniq -c is very useful)
| A popular idiom in unix is to use “sort | uniq -c | sort -n “. We will cover these in more detail in another article. |
Good links on thread dumps:
- Understanding thread dumps.
- Search for thread dump analyzers in the net.
Memory Model
Profilers give the number of instances for individual classes that are extant in the JVM at some point in time. The highest number of instances would be found for basic classes such as “java.lang.String”. But on the whole, there should be a co-relation between the number of threads and the number of instances of most of the classes. However, this rule would not be applicable for cached classes.
We will talk more the optimal memory model for an application in a subsequent article.
In summary, a static and dynamic analysis of the application is a pre-requisite to probe its behavior from a performance stand point.


Comments